
Startups don’t fail because they lack ideas—they fail because they track the wrong startup metrics or misunderstand the right ones. In early stages, it’s easy to focus on vanity numbers like downloads or website visits. But those rarely tell you if your business is actually working.
What matters is understanding the metrics that signal real traction, sustainable growth, and long-term viability—from achieving product–market fit to building strong retention.
This guide breaks down the most important startup metrics, explains how they connect, and shows how founders and marketers can use them to make smarter decisions.
In competitive markets across the US, UK, and Europe, startups operate under tight budgets and high expectations. Investors, partners, and even early customers expect data-backed progress.
Tracking the right metrics helps you:
Validate whether your product solves a real problem
Allocate budget more efficiently
Identify growth bottlenecks early
Build a predictable revenue model
Key insight: Metrics are not just for reporting—they are tools for decision-making.
Product–Market Fit: The First Metric That Matters
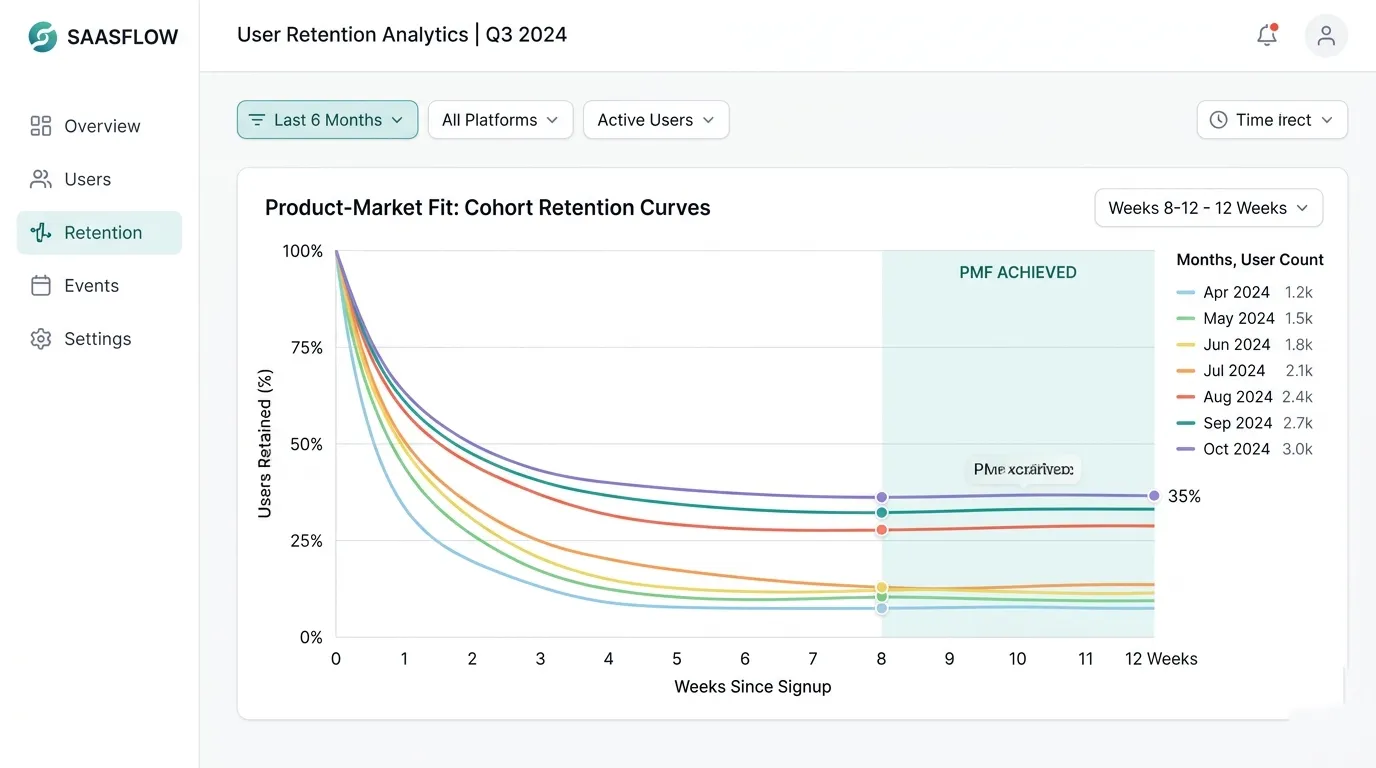
Before scaling anything, you need evidence that people actually want your product. This is where product–market fit metrics come in.
What Is Product–Market Fit?
Product–market fit (PMF) means your product satisfies a strong market demand. Without it, growth is temporary and expensive.
Key Metrics to Measure PMF
1. Retention Curve (Cohort Retention)
If users keep coming back over time, it’s a strong signal of value.
A flat retention curve (instead of dropping to zero) indicates PMF
Example: A SaaS tool in the US retains 30–40% of users after 3 months
2. Net Promoter Score (NPS)
Measures how likely users are to recommend your product.
Score above 50 = strong PMF signal
Widely used in both US startups and European SaaS companies
3. “Would You Be Disappointed?” Survey
Ask users: “How would you feel if you could no longer use this product?”
If 40%+ say “very disappointed”, you likely have PMF
Common Mistake
Focusing on user growth before retention. Growth without PMF leads to high churn and wasted acquisition costs.
Customer Acquisition Cost (CAC): The Cost of Growth
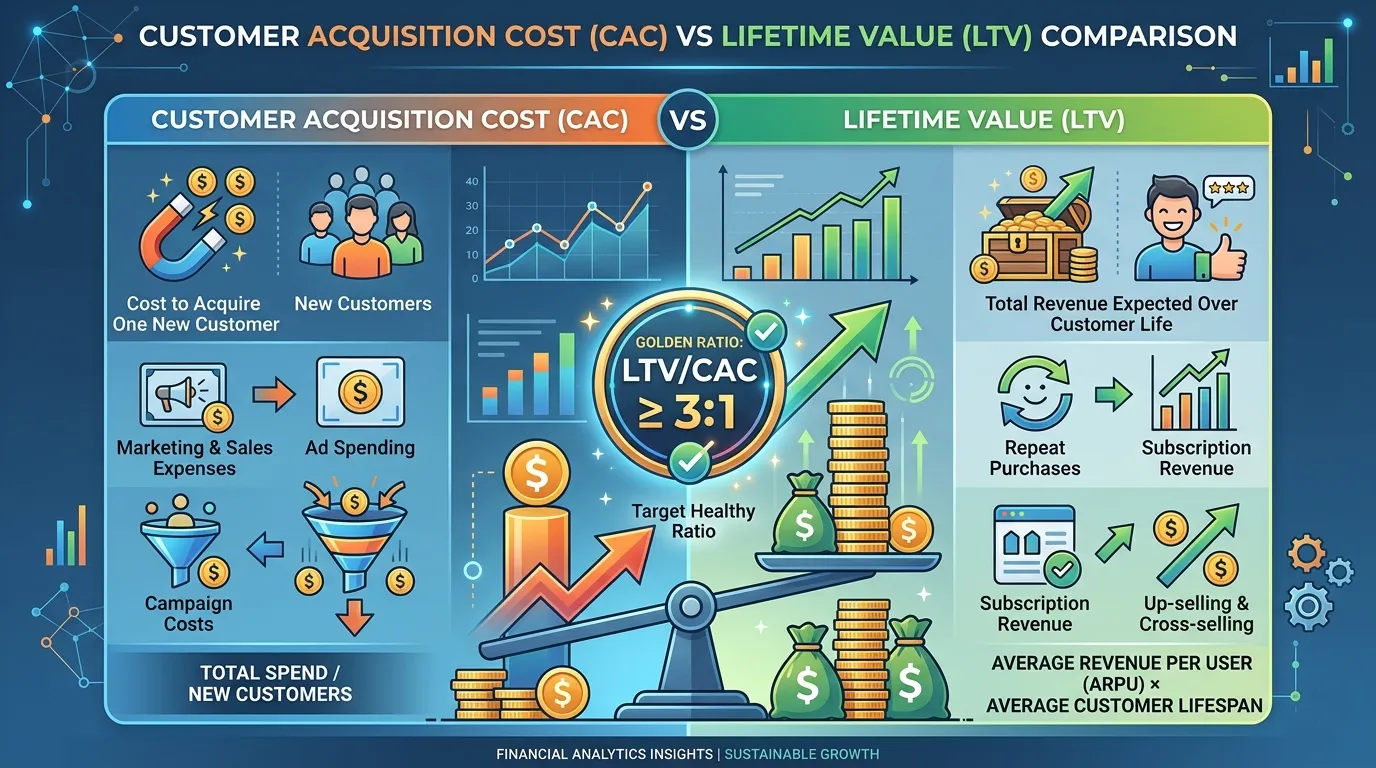
Once you have early traction, the next step is understanding how much it costs to acquire customers.
What Is CAC?
Customer Acquisition Cost (CAC) is the total cost of acquiring a new customer. Formula:
CAC = Total Sales & Marketing Spend / Number of New Customers
Example
Startup spends $10,000 (USD) or €9,000 (EUR) on ads and marketing
Acquires 200 customers
CAC = $50 (or ~€45) per customer
Why CAC Matters
Determines scalability of your growth strategy
Directly impacts profitability
Critical for investors evaluating your startup
Optimization Tips
Focus on high-converting channels (e.g., SEO, referrals)
Improve onboarding to increase conversion rates
Test messaging for different regions (US vs EU audiences)
Lifetime Value (LTV): The Revenue Engine
If CAC tells you how much you spend, Lifetime Value (LTV) tells you how much you earn.
What Is LTV?
LTV is the total revenue you expect from a customer over their relationship with your business.
Simple Formula
LTV = Average Revenue per User (ARPU) × Customer Lifespan
Example
Monthly subscription: $20 (or €18)
Average customer lifespan: 12 months
LTV = $240 (or ~€216)
The Golden Rule
LTV should be at least 3× CAC
If CAC = $50 → LTV should be $150+
This ratio is a common benchmark in US and European SaaS markets
Common Mistake
Overestimating LTV by ignoring churn. Always base calculations on real retention data.
Churn Rate: The Silent Growth Killer
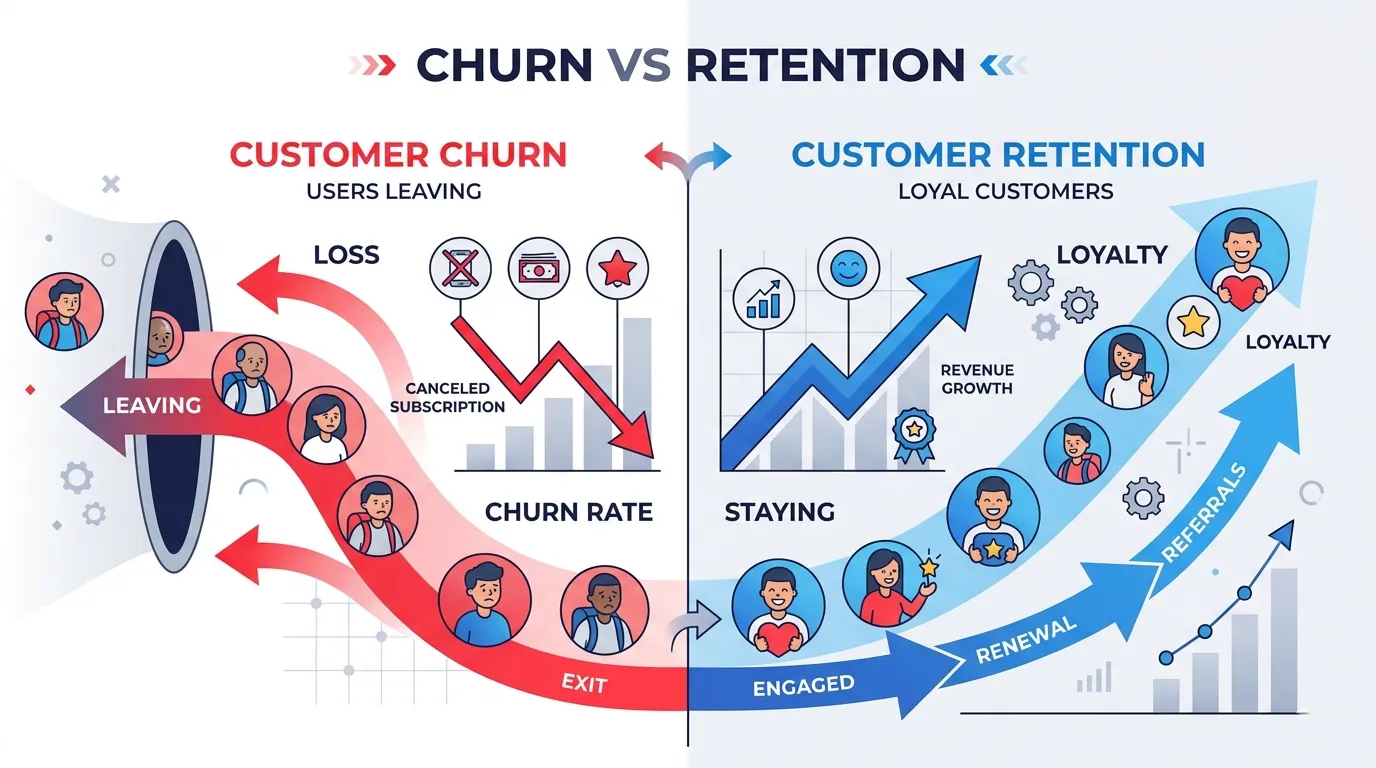
You can’t talk about startup metrics without addressing churn.
What Is Churn?
Churn rate measures how many customers stop using your product over a given period. Formula:
Churn Rate = Customers Lost / Total Customers at Start
Example
Start with 1,000 users
Lose 100 users in a month
Churn = 10%
Why Churn Matters
High churn destroys LTV
Increases pressure on acquisition
Signals poor product experience
Benchmarks
SaaS startups:
<5% monthly churn = strong
5–10% = needs improvement
10% = critical issue
How to Reduce Churn
Improve onboarding experience
Add customer support early
Identify “drop-off” points in user journeys
Use feedback loops (surveys, interviews)
Retention Rate: The True Growth Metric
While churn shows loss, customer retention rate shows strength.
What Is Retention Rate?
Retention measures the percentage of users who continue using your product over time. Formula:
Retention Rate = (Customers at End – New Customers) / Customers at Start
Why Retention Is Critical
Retention is often more important than acquisition because:
It increases LTV
Reduces reliance on paid marketing
Creates compounding growth
Real-World Insight
Many successful startups in the UK and Western Europe focus heavily on retention before scaling marketing budgets. This approach reduces risk and improves long-term profitability.
Practical Retention Strategies
Personalised onboarding flows
Regular feature updates based on user feedback
Email and in-app engagement campaigns
Loyalty or subscription incentives
Activation Metrics: The First “Aha” Moment
Activation measures how quickly users experience value.
What Is Activation?
It’s the point where a user completes a key action that shows they understand your product’s value.
Examples
SaaS: Creating first project or dashboard
E-commerce: Completing first purchase
Mobile app: Completing onboarding + first action
Why Activation Matters
Strong activation leads to higher retention
Weak activation leads to early churn
How to Improve Activation
Simplify onboarding steps
Highlight key features early
Remove unnecessary friction
Tip: Track time-to-value (how long it takes users to reach activation).
North Star Metric: Aligning Your Startup
A North Star Metric (NSM) is the single metric that best captures your startup’s value.
Examples
SaaS: Active users completing key tasks
Marketplace: Successful transactions
Content platforms: Time spent engaging
Why It Matters
Aligns product, marketing, and growth teams
Keeps focus on long-term value—not vanity metrics
How to Choose the Right NSM
Your North Star should:
Reflect customer value
Be measurable and actionable
Correlate with revenue growth
Putting It All Together: A Simple Metrics Framework
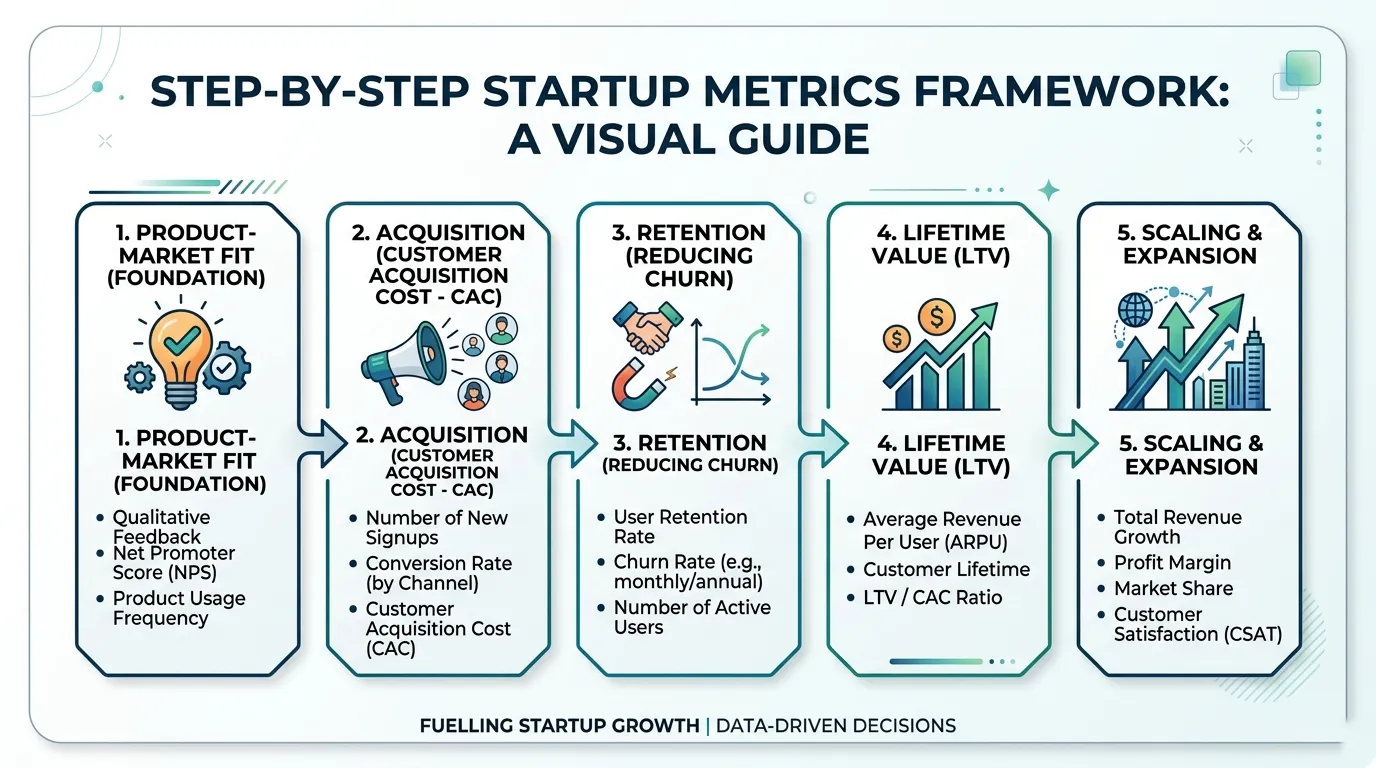
To simplify decision-making, use this structured framework:
Stage 1: Validation
Product–market fit metrics
Activation rate
Stage 2: Efficiency
CAC
Conversion rates
Stage 3: Sustainability
Retention rate
Churn rate
LTV
Stage 4: Scale
LTV:CAC ratio
North Star Metric
Key takeaway: Each metric builds on the previous one. Skipping stages leads to fragile growth.
Common Startup Metrics Mistakes to Avoid
1. Tracking Too Many Metrics
Focus on a few high-impact KPIs instead of overwhelming dashboards.
2. Ignoring Cohort Analysis
Aggregate data hides important trends. Always analyze by cohorts.
3. Prioritizing Growth Over Retention
Scaling without retention leads to high churn and wasted spend.
4. Misinterpreting Data
Context matters. A 5% churn rate may be good or bad depending on your model.
5. Not Acting on Insights
Metrics are useless unless they lead to decisions.
Conclusion: Focus on Metrics That Drive Real Growth
The difference between successful startups and struggling ones often comes down to which startup metrics they prioritize.
From achieving product–market fit to improving retention and optimizing CAC, each metric plays a role in building a scalable, sustainable business.
Key takeaways:
Start with product–market fit before scaling
Balance CAC and LTV for profitability
Reduce churn and improve retention to access growth
Use a North Star Metric to align your team
Action step:
Audit your current metrics. Identify one weak area (e.g., high churn or low activation) and focus on improving it over the next 30 days.